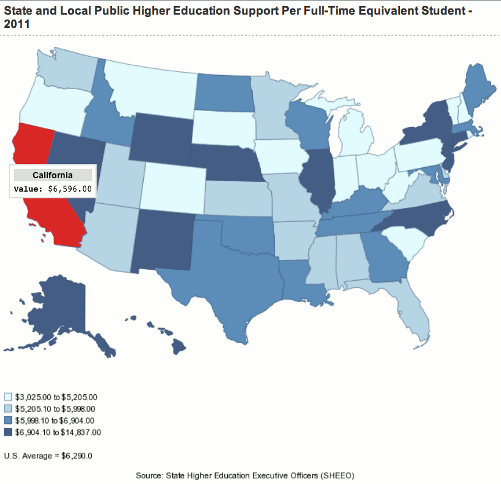
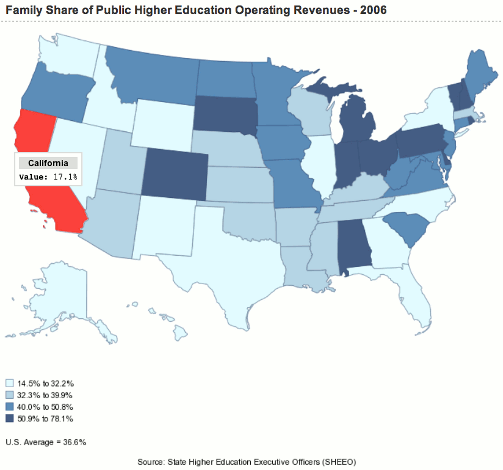
Public universities and colleges are partially funded by student tuition and partially by state and local government revenues (i.e. taxes collected), alongside subsidies by the Federal government and private donations. Public funding is then allocated per full time student, as shown in the map below. Alaska contributes the most per student at $14,837, while the U.S. average is $6290. I’ve highlighted California, since that’s Creative Marbles Consultancy’s home state. After receiving public revenues, families and students are then responsible for the remaining costs of college–as seen in the second map. When considering public universities for application and eventual enrollment, parents and prospective students would be wise to ask questions about predicted state and local funding per student in the future, in order to forecast any increases in tuition throughout their 4-5 years of education.

As state and local governments have been experiencing financial constraints with the recent recession, families are being asked to shoulder a greater percentage of the costs of college. The map below shows the general percentage of public college costs that a family can expect to cover, by state. Families on average across the U.S. pay for 36.6% of higher education costs, while in California, where Creative Marbles is located, families pay 17.1% of higher education costs–less than half the national average. In Vermont, families can expect to pay 78.1% of higher education costs. If costs are a determining factor in choosing a public college, either out-of-state or in your home state, the below graph can help forecast the out-of-pocket amount your family may be responsible for paying over the next four years. (Note: This figure maps 2006 costs, 2 years before the recent recession and the 98.3% increase in University of California tuition since 2008. In 2011-12, families were expected to pay 41% of the costs of a University of California education.)
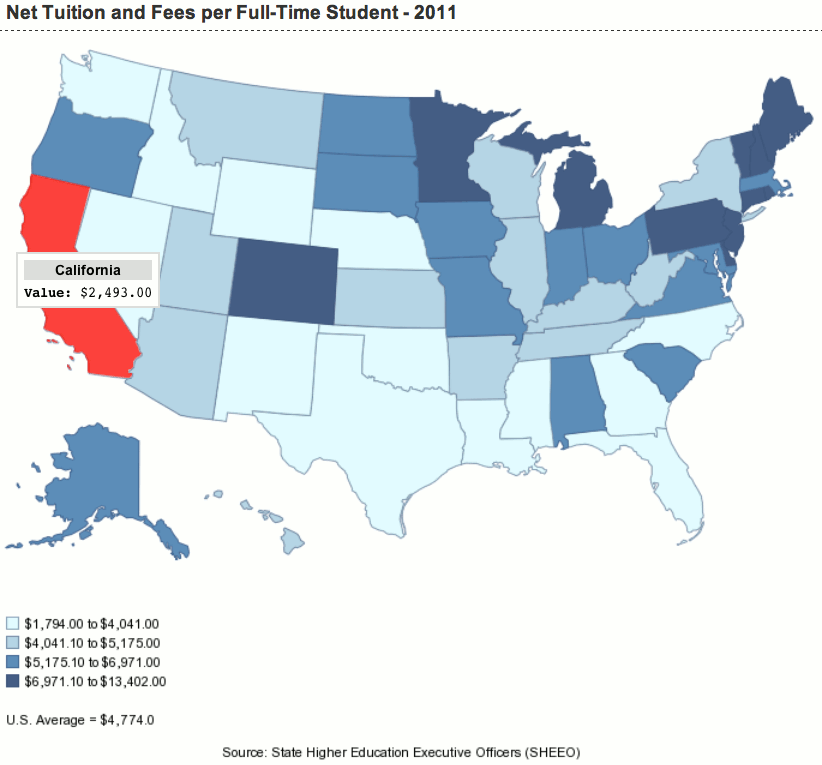
The map below shows the net tuition families pay at a publicly funded college by state–again highlighting California.
Public universities and colleges, in general, are raising their tuition and fees at higher percentages than private universities, according to the College Board. However, the price of tuition is only one measurement of value of the college experience. Take to heart U.S. Secretary of Education’s, Arne Duncan’s, remarks, ““While it’s never been more important to have a degree, a certificate or an industry-recognized credential — it’s also never been more expensive,” and roll up your shirt sleeves and think through your college choices thoroughly and carefully.
Maps Credit: National Information Center for Higher Education Policymaking and Analysis


